
Navigating Code Complexity: Visualizing Large Codebases with AI-Powered Diagrams
Understanding large codebases can feel like navigating a labyrinth. Traditional methods often fall short, especially with the growing complexity of modern software projects. But what if you could see the entire system laid out before you, like a map? That’s the promise of new visualization tools that leverage the power of AI.
The Challenge of Understanding Complex Code
Developers are increasingly productive, thanks in part to powerful code generation tools. But even with these advancements, grasping the structure and relationships within a massive codebase remains a significant hurdle. Text-based searches and code browsing tools can only take you so far. They often lack the big-picture view needed to truly understand how everything fits together.
Visualizing the Solution: Enter Codebase Mapping
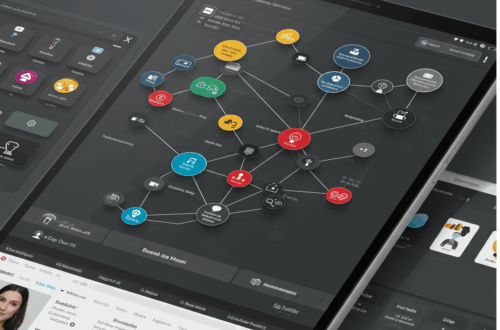
Imagine a tool that generates an interactive diagram of your entire project. You start with a high-level overview, then zoom in to explore specific modules, functions, and even dependencies. This is the concept behind codebase mapping, and it’s quickly becoming essential for navigating large and complex software systems. These tools leverage static analysis and Large Language Models (LLMs) to automatically generate these visual representations.
How AI Helps Create Accurate Diagrams
LLMs can help understand code and identify key components. However, relying solely on LLMs for analysis can lead to inaccuracies, as they sometimes “hallucinate” relationships that don’t actually exist in the code. So, robust visualization tools combine the strengths of LLMs with the precision of static analysis. The static analysis acts as a ground truth, validating the LLM’s output and ensuring the generated diagram is accurate and reliable.
Addressing Scalability and Context Window Limitations
One of the main challenges with codebase mapping is handling massive projects like PyTorch. Traditional tools often struggle to scale, and even LLMs can get bogged down by enormous context windows. Innovative solutions are being developed to overcome these limitations, such as incorporating an MCP-server to provide on-demand documentation for dependencies. This reduces the reliance on the LLM to infer relationships and helps manage the size and complexity of the analysis.
Getting Started with Codebase Visualization
While specific tools and implementations vary, the general approach to creating these diagrams follows a similar pattern:
- Static Analysis: The process begins with a thorough static analysis of the codebase to extract information about its structure, dependencies, and relationships.
- LLM Augmentation: LLMs are then used to interpret the code and identify key components and their interactions. This helps create a higher-level understanding of the code’s functionality.
- Validation and Refinement: The LLM’s output is cross-referenced with the results of the static analysis to ensure accuracy and eliminate any hallucinations.
- Visualization: Finally, the tool generates an interactive diagram that represents the codebase visually, allowing developers to navigate and explore the system.
The Future of Code Navigation
As AI continues to transform software development, codebase visualization tools are likely to become indispensable. By providing a clear and intuitive view of complex systems, they empower developers to understand, navigate, and maintain code more effectively. This leads to improved collaboration, faster debugging, and ultimately, better software.